
Spain ships tens of tonnes of cannabis abroad, yet its patients can only reach two products
Spain authorised 18.3 tonnes of cannabis exports between January and June 2026 — a pace that would finish the year around a fifth above


Spain authorised 18.3 tonnes of cannabis exports between January and June 2026 — a pace that would finish the year around a fifth above

Nine months of regulated supply tripled Dutch coffeeshop assortment to 78 products per shop. Flower fell 13%, hash menu prices rose 81%. What the

Portugal exported 66,305 kg of medical cannabis in H1 2026 — 83% of its entire 2025 total, in half the time — while licensed

Australia imported a record 81.1 tonnes of cannabis flower in 2025 and grew another 55.3 tonnes at home — the strongest year on record

Retail flower has halved in two years. Canadian import prices are down 28.7% from their peak even as shipment volumes climbed nearly fivefold. And

In May 2026 the United Kingdom listed its first medical hash — Canadian-sourced static hash, crumble and ice-water hash — the clearest sign yet
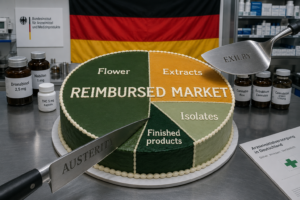
On 10 July 2026 the Bundestag reshaped Germany’s reimbursed medical cannabis market — striking dried flower from statutory cover and gating extracts, dronabinol and

Switzerland’s 2022 reform made medical cannabis legally accessible to any prescriber, yet two years of federal MeCanna data reveal a market still defined by

Nearly 500 active clinical trials. A 3.5-fold rise in annual trial starts in five years. A decisive pivot away from CBD isolates toward whole-plant,

The UK private medical cannabis market has scaled at a +113% CAGR through 2024. H1 2025 is tracking above 15 tonnes on Q2 run-rate.