
Australia Imports a Record 81 Tonnes as Its Medical Cannabis Market Contracts for the First Time
Australia imported a record 81.1 tonnes of cannabis flower in 2025 and grew another 55.3 tonnes at home — the strongest year on record


Australia imported a record 81.1 tonnes of cannabis flower in 2025 and grew another 55.3 tonnes at home — the strongest year on record

Retail flower has halved in two years. Canadian import prices are down 28.7% from their peak even as shipment volumes climbed nearly fivefold. And

In May 2026 the United Kingdom listed its first medical hash — Canadian-sourced static hash, crumble and ice-water hash — the clearest sign yet
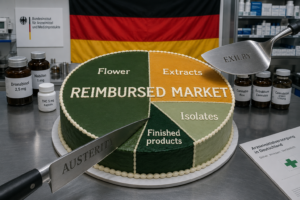
On 10 July 2026 the Bundestag reshaped Germany’s reimbursed medical cannabis market — striking dried flower from statutory cover and gating extracts, dronabinol and

Switzerland’s 2022 reform made medical cannabis legally accessible to any prescriber, yet two years of federal MeCanna data reveal a market still defined by

Nearly 500 active clinical trials. A 3.5-fold rise in annual trial starts in five years. A decisive pivot away from CBD isolates toward whole-plant,

The UK private medical cannabis market has scaled at a +113% CAGR through 2024. H1 2025 is tracking above 15 tonnes on Q2 run-rate.

276 tonnes of medical cannabis flower. C$643 million in export value. Roughly three-quarters of the world’s legal medical supply. Canada’s 2025 export data does

Germany’s pharmacy sell-out market surpassed €1 billion for the first time in 2025, with imports reaching a record 201.1 tonnes (+176% YoY) — making

Czechia’s medical cannabis programme grew 46% in 2025—the strongest year since 2021. Full-year SÚKL data confirms the GP reform partially worked: prescribing doctors rose